SERVICES
Revenue Generation
Grow the number — and be able to say which work grew it.
Every growth problem arrives sounding the same: we need more revenue. But the reason the number isn’t moving is different every time, and the fix that works for one business will do nothing for another.
Sometimes you can’t see which effort created the demand; sometimes the demand itself moved; sometimes revenue is fine and the margin isn’t. Three different jobs — and starting the wrong one costs a year.
Where the number actually comes from
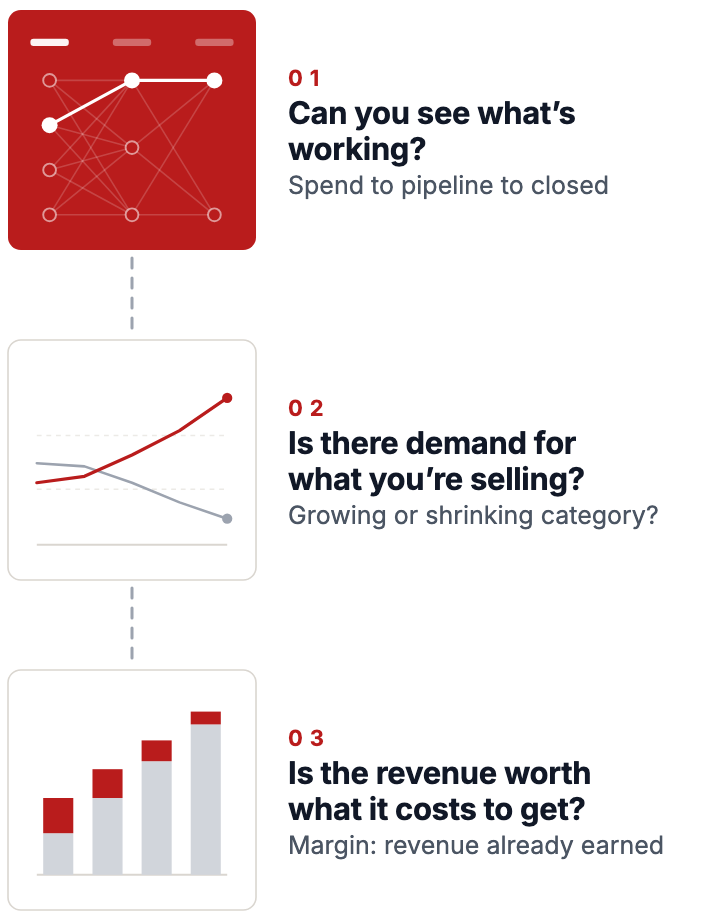
Three questions, in this order.
1. Can you see what’s working?
Most companies can’t connect spend to pipeline to closed business. The reporting either doesn’t exist or doesn’t agree with itself — so nobody can say which work produced revenue and which produced activity. You can’t scale what you can’t see.
2. Is there demand for what you’re selling?
Are you in a growing category or a shrinking one? Better execution doesn’t fix a market that moved.
3. Is the revenue worth what it costs to get?
A growing top line with a shrinking margin is a slower route to the same problem. Margin is revenue you have already earned — it’s usually the cheapest growth available.
What I do

- Funnel diagnosis — where demand is created, where it stalls, and where it leaks
- Attribution you can explain to a board or an owner, not a black box that produces a number nobody can defend
- Customer acquisition built for repeatable volume, not one good quarter
- Positioning and pricing pressure-tested against the market you’re actually in
- Cost structure, because the fastest revenue is often the revenue you’re already losing
What this looks like
ELB Learning
Six acquisitions — Trivantis, Edulence, The Game Agency, CoreAxis, Origin Learning and Rehearsal — had left one company operating as seven brands, on separate systems with separate reporting. Nobody could say what was working, so nobody could spend with confidence. Unified into one brand on one stack, with HubSpot and Google Ads connected so the numbers finally agreed. 8x average return on marketing investment, dashboards tracing $6M+ in revenue and $500K+ in new clients inside six months. $10M → $50M.

The New York Times
Journalism was going free, and a century-old business had to build demand for the things readers would still pay for: the Store, Wine Club, Travel, the Crossword, gift subscriptions. The first Black Friday subscriber email returned $1.9M in incremental billings.
Trivantis
Advertising was outsourced and the technology stack had grown well past what the business actually used. Restructured the department, brought advertising in-house, and cut the stack to what earned its place. 63% off the technology budget, $250K saved, revenue $8M → $10M — growth funded largely by money the business already had.
Find your lane forward.
Tell me which number isn’t moving. I’ll find out why — and if the answer is that you don’t need what I sell, I’ll tell you that too.